NMI MRM Residuals Calculation: Reporting and Management
Save time, avoid manual effort and increase accuracy with a universal reporting dashboard and automatic residuals calculations.
Your residuals represent the majority of your ISO’s revenues. However, analyzing, managing and calculating residuals is a complex and time-consuming job. As your business grows, these calculations become more intricate.
NMI’s Merchant Relationship Management (MRM) solution is designed to eliminate the most complex and tedious work associated with managing residuals. It does this by automating data presentation and residuals calculations, so you can spend more time using data and less time trying to wrangle it.
The platform provides access to all your residuals data in one place — no matter how many payment processors you’re partnered with. The reporting dashboard is clearly organized, easy to navigate and highly flexible. This allows you to access the data you need quickly without having to sift through a sea of numbers.
The MRM’s reporting dashboard impacts the entire organization, giving managers more time to focus on the big picture and improving agent satisfaction.
Features Overview Section
NMI’s MRM residuals reporting suite streamlines all areas of your residual management, calculation and payout.
Just some of the features included in this game-changing tool include:
Complete, Centralized Residuals Reporting
Complete, Centralized Residuals Reporting
Access All of Your Data, From All of Your Processors, in One Convenient Place.
The most successful ISOs work with multiple payment processors to ensure every new merchant has access to the right solution for their unique needs. However, working with all those processors can mean major headaches when residual numbers come out each month.
The MRM residuals reporting suite makes your life easier by automatically pulling your data from each payment processor, analyzing it and combining it all in a central, easy-to-use analytics dashboard.
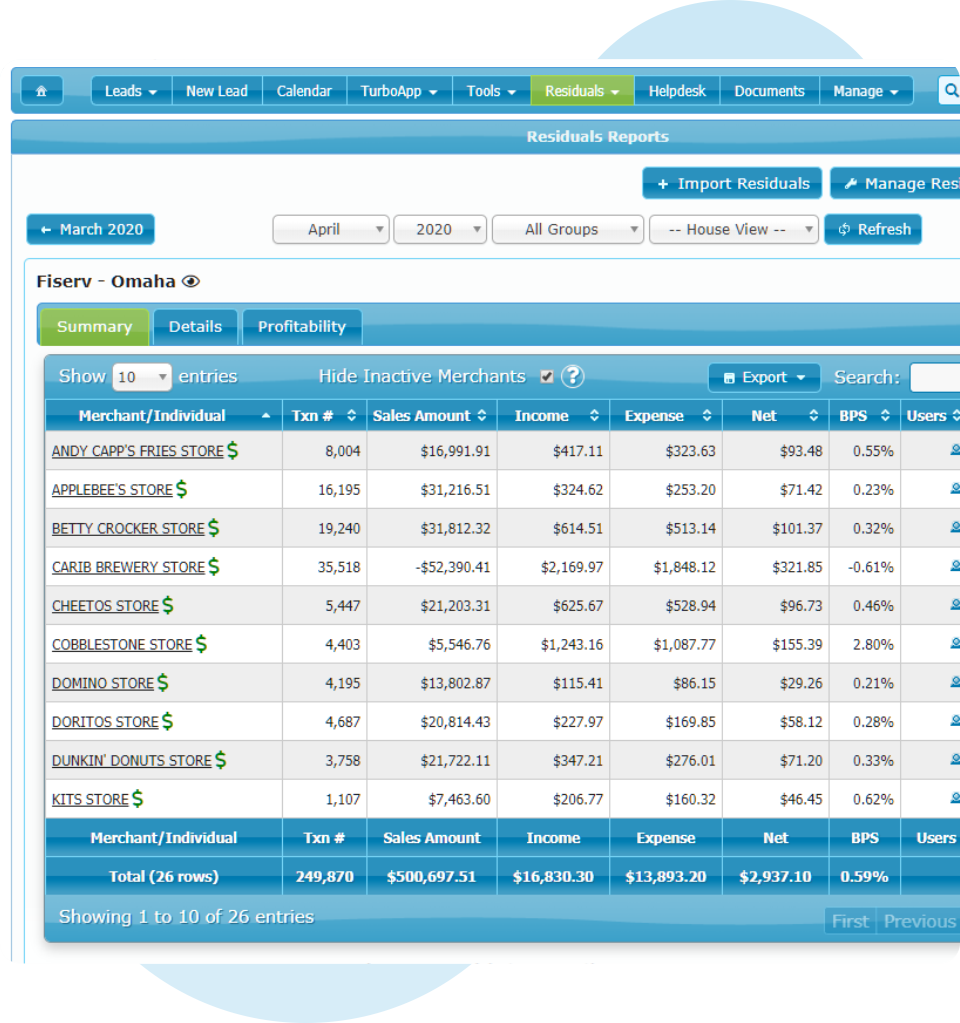
With this solution, simply open the reporting suite to see residuals data from each payment processor on one screen. Data is broken down by processor and clearly laid out, with each offering independent summaries, details and profitability views.
You and your team will never again have to manually access multiple residuals reports or struggle with collating data from different processors. Instead, the MRM does it for you and houses all the information you need just a click or two away.
Automated Residuals Calculations

Automated Residuals Calculations
Eliminate Headaches and Calculate Payouts With Unparalleled Speed and Accuracy.
Residuals calculations can be complex. That’s especially true for large ISOs working with several payment processors and a large team of independent agents on different contracts (with different splits).
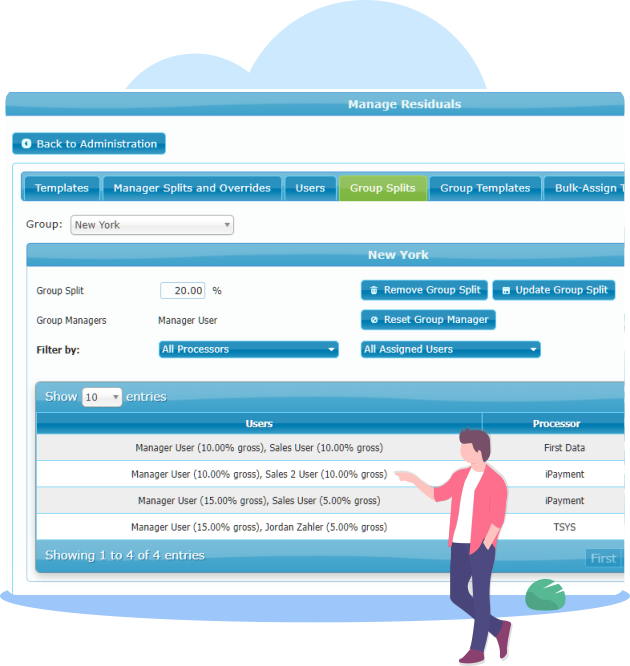
NMI’s MRM residual reporting suite automatically calculates your residuals each month, including the net payments due to each of your agents. That eliminates the process of manual residual calculations, saving you significant time and resources. More importantly, it removes the risk of human error, ensuring your agents’ payouts are accurate to the penny month in and month out.
With our robust MRM, your managers will spend less time working through dense reporting and calculations and more time handling big-picture issues. The result is happier agents, better overall performance and more substantial growth.
Portfolio-Wide Metrics
Portfolio-Wide Metrics
Bring the Big Picture Into Clearer Focus.
Having a clear view of your residuals on the portfolio level enables you to monitor the long-term health of your business and ensure that the company’s strategies are solid and growth is trending upward.
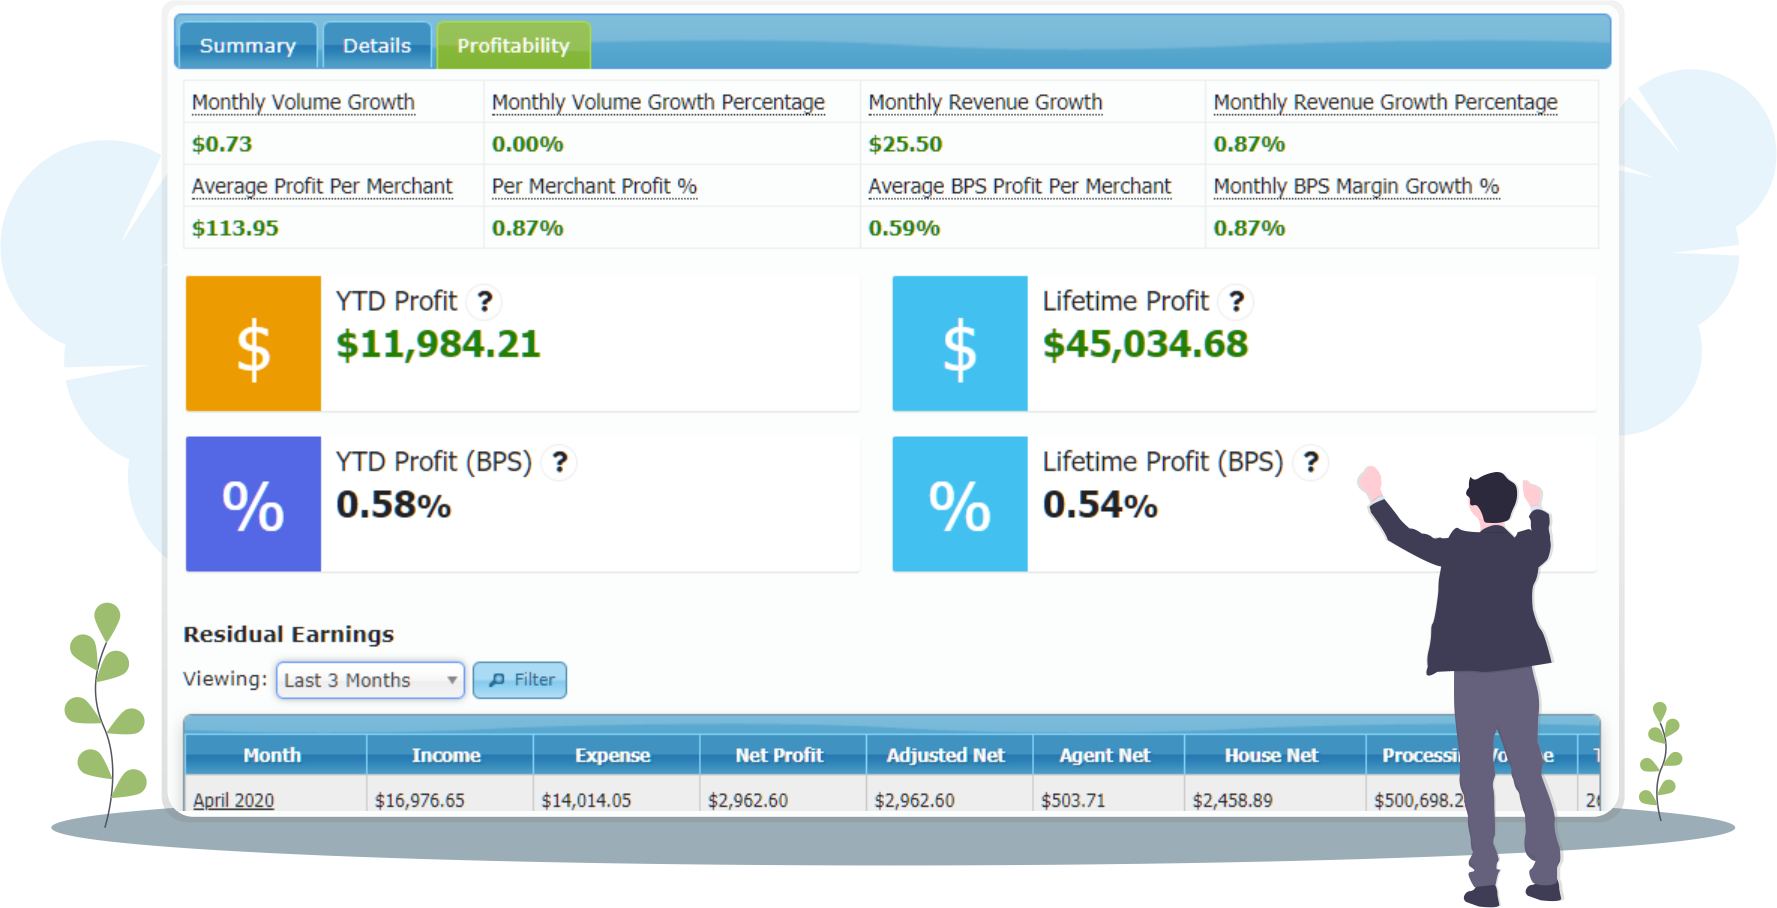
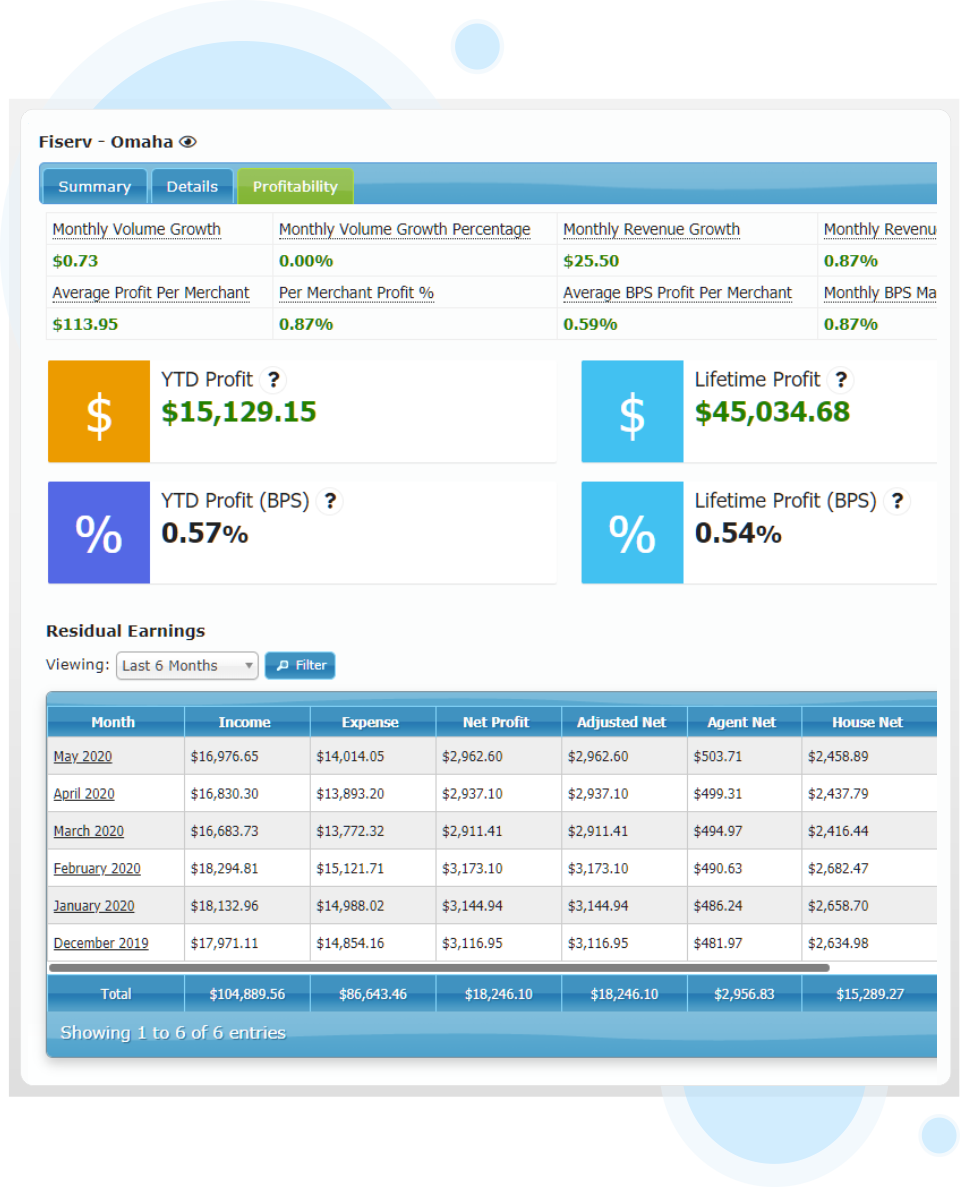
Our residuals reporting dashboard provides fast, easy access to complete portfolio-wide metrics from each of your payment processors, including:
- Monthly volume growth in dollars and as a percentage
- Monthly revenue growth in dollars and as a percentage
- Average profit per merchant in dollars, BPS and as a percentage
- Monthly BPS margin growth as a percentage
- YTD profit in dollars and BPS. Lifetime profit in dollars and BPS
With this feature, management can easily access key growth indicators and analytics wherever and whenever they’re needed. That unparalleled access to useful, deep business intelligence enables better decision-making in both the short and long terms, greatly enhancing any ISO’s ability to maximize growth.
Merchant Level Metrics
Merchant Level Metrics
Monitor Your Merchants To Identify Top Performs and Opportunities for Improvement.
Your merchants drive your residuals, growth and long-term success. Knowing which are exceeding expectations and which are struggling is vital to appropriately directing resources. But only tracking your residuals at the portfolio level leaves essential data on the table.
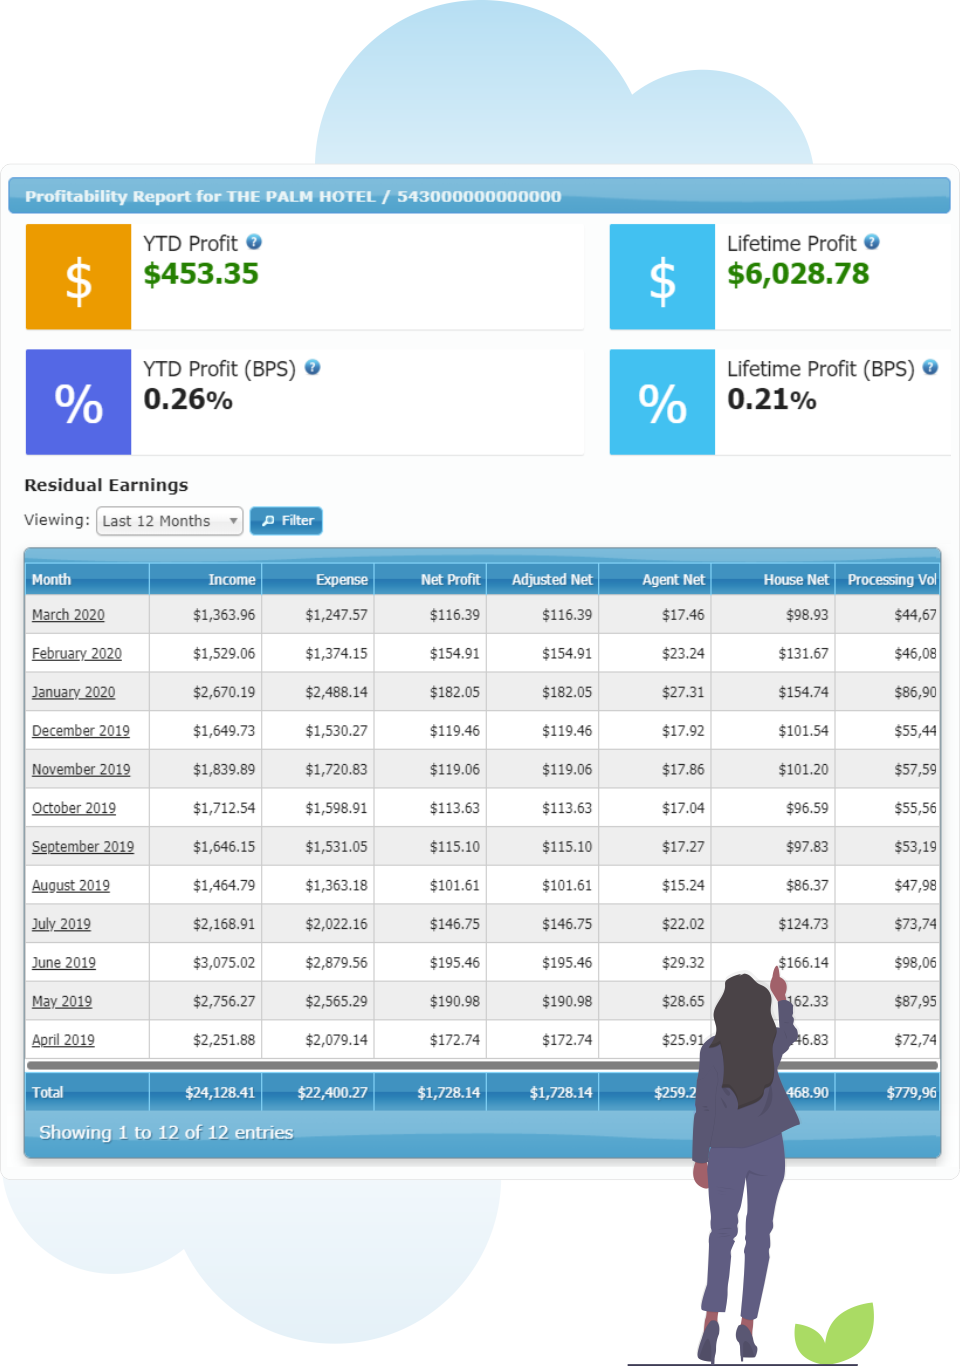
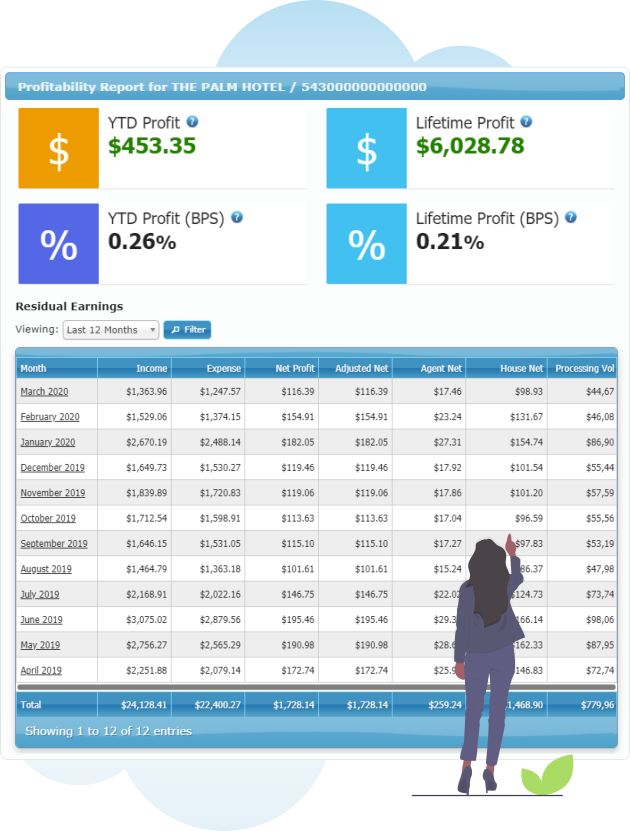
Our MRM provides a full set of merchant-level metrics through the residuals reporting dashboard. It also shows financial data through every account, so you can see how each merchant is performing.
Merchant-level metrics included in the residuals reporting suite include:
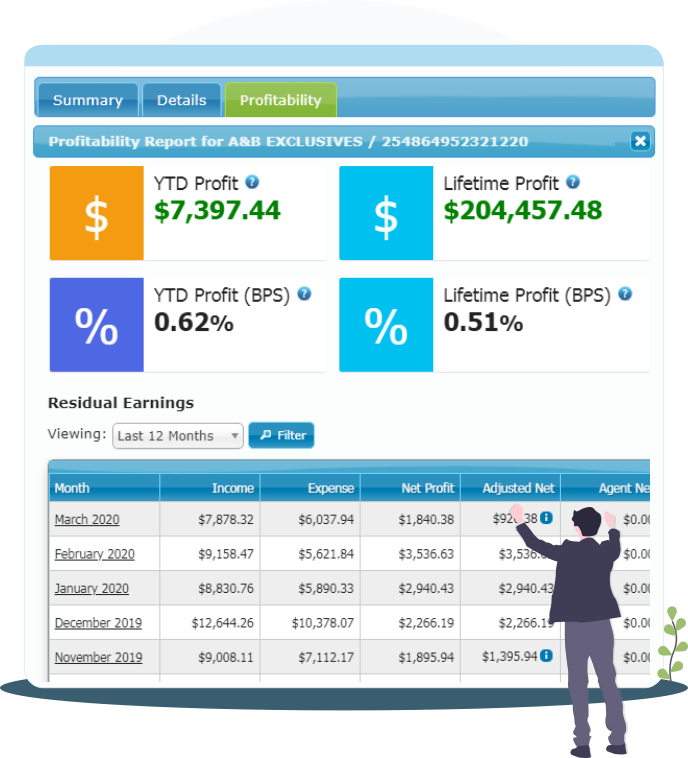
- YTD merchant profit in dollars and BPS
- Lifetime merchant profit in dollars and BPS
- 12 months of data at a glance
By quickly referencing each merchant’s profitability, you can identify and monitor top performers. This allows you to better determine how to dedicate time and service resources. It also ensures you can identify problem merchants and merchants failing to process enough transactions early, enabling your team to take remedial action before you lose money.
Flexible Data Presentation
Flexible Data Presentation
View the Data You Need, When You Need It, Without Clutter or Distraction.
With a large portfolio, a team of independent agents and a roster of merchants across multiple payment processors, you need a lot of data to calculate residuals accurately. Unfortunately, too much data can hinder good decision-making and planning, especially if the information is messy and unorganized.
Our MRM’s residuals reporting suite solves that problem by putting you in full control over the data you view and how it’s presented. Reporting metrics are configurable in a matter of clicks.
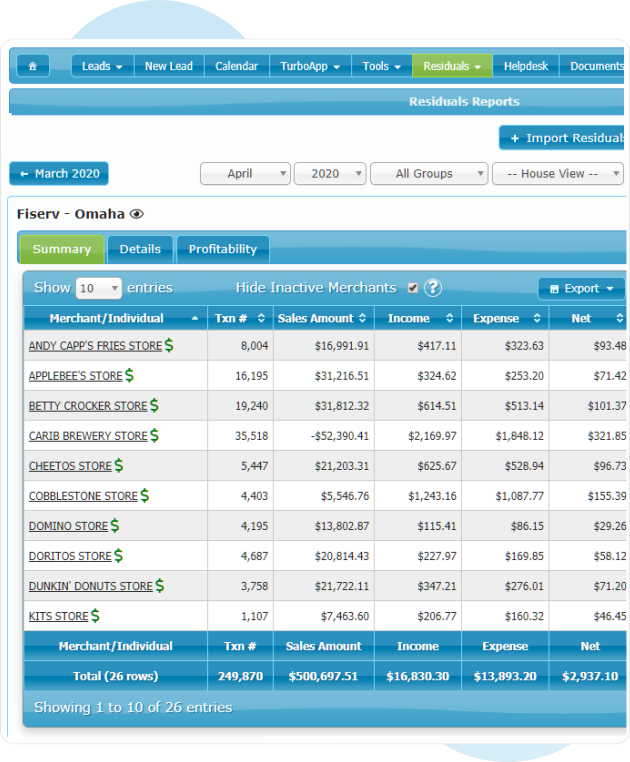
The top-level residuals page shows your current month’s residuals by merchant. Information is neatly sorted into separate widgets by payment processor and includes each merchant’s transaction volume and sales amount, your income, expenses, net, and BPS %, the split, and the agent’s net.
Clicking through to the detail tab provides additional information like MID and return volume. Finally, the profit tab provides complete data on processor-level monthly growth and revenue, and year-to-date and lifetime profit in dollars and BPS.
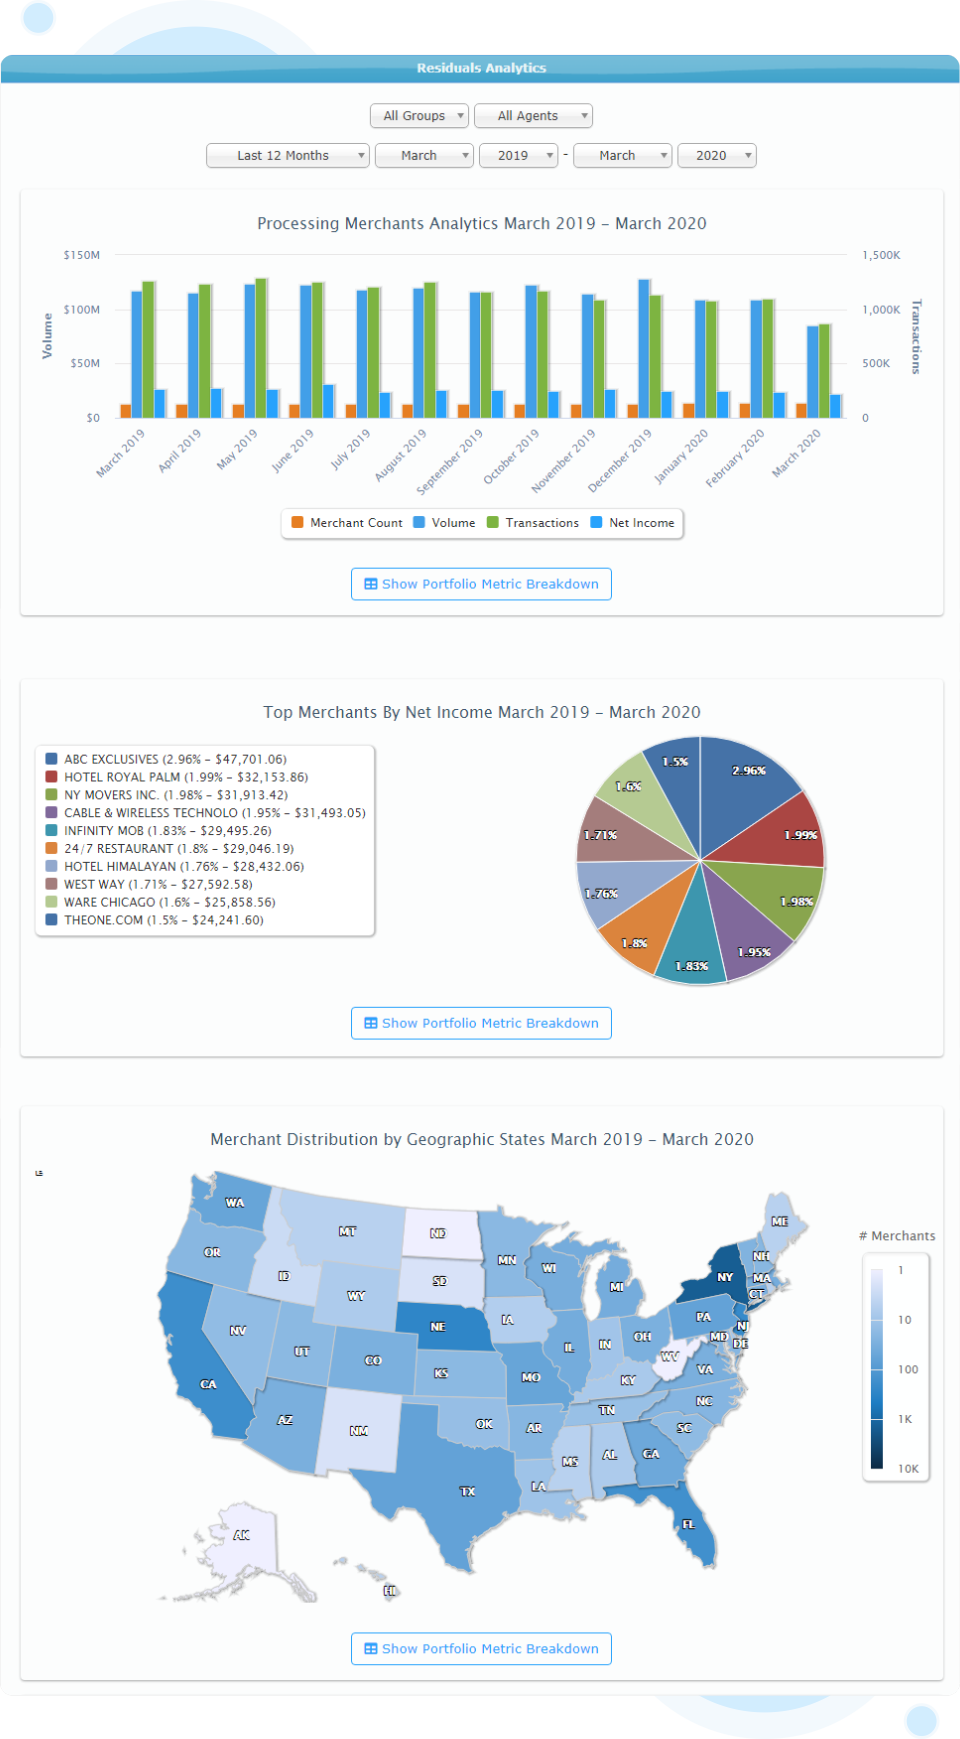
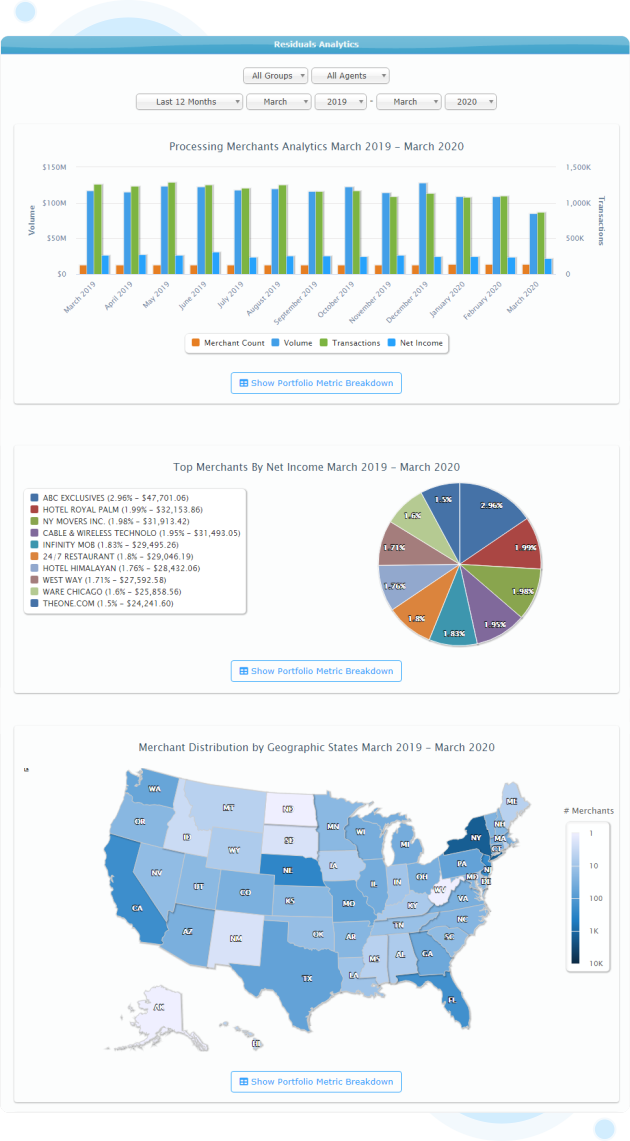
The Residuals Analytics page provides a series of easy-to-read graphs providing at-a-glance information on:
- Profitability analytics
- Processing-merchants analytics
- Financial key indicators
- Top merchants by volume and net income
- Merchant distribution by geographic states
- Industry analytics
The dashboard also enables you to view your residuals as individual line items. Alternatively, you can use the exceptions tab to focus solely on residuals with unassigned users or percentages.
Integrated Agent Payment Capability
Integrated Agent Payment Capability
Pay Your Agents Faster To Maintain Loyalty and High Morale.
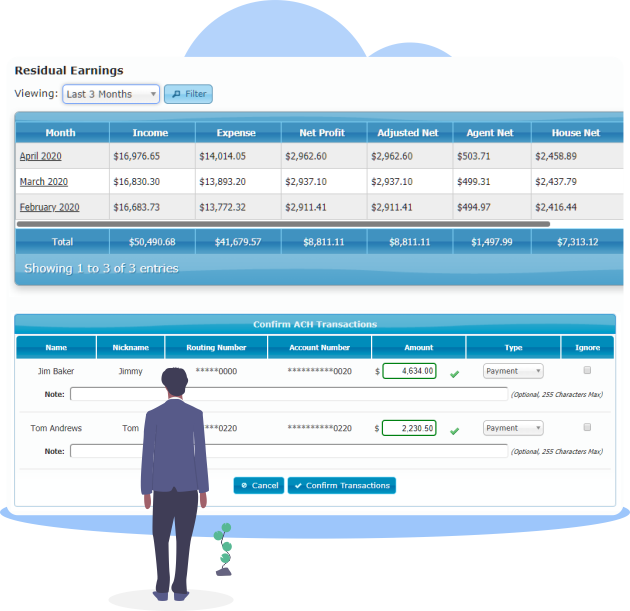
Residual publication is a highly anticipated time. It normally takes a significant amount of time to collate data, calculate payouts and issue payments. Because of this, most agents receive their payouts roughly a week after their ISO receives their residuals numbers from the payment processor.
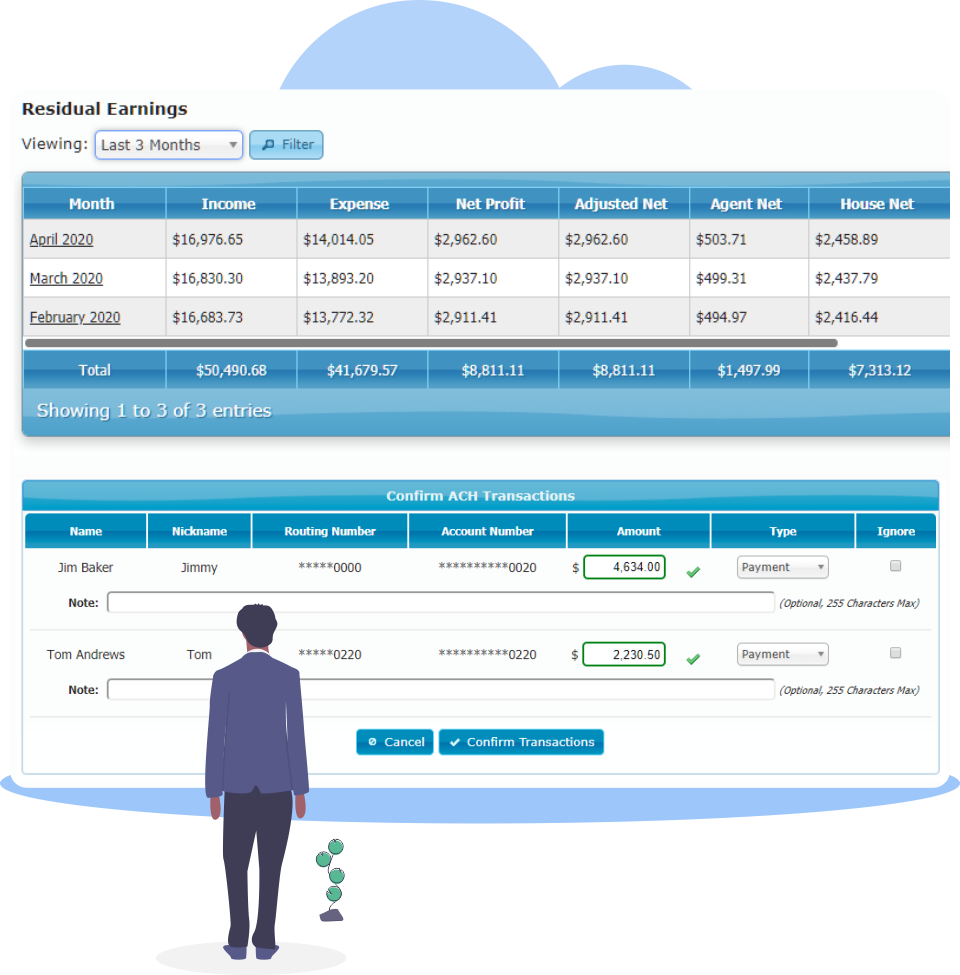
With our robust MRM, you can reduce the time from publication to payout with the platform’s automatic residual calculations and billing and payment integration. Once your numbers drop, the MRM will provide you with automatic residuals calculations based on each agent’s contract and split percentage. You can then use the integrated ACH payment tools to send out your agents’ payments immediately over the ACH network.
The result is happier agents who know they can depend on prompt, accurate payments every month — an enormous advantage in attracting the best talent.
Easily Import Previous Residual Data

Easily Import Previous Residual Data
Integrate Your Historic Residuals To Enable Easier Review.
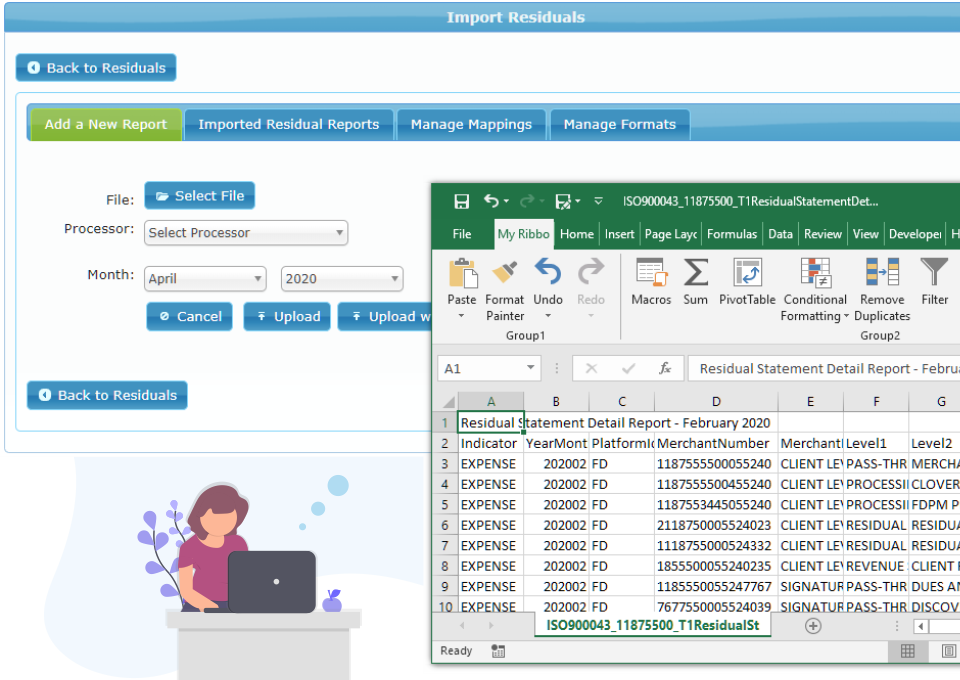
NMI’s MRM enables you to easily upload previous residuals reports using the Residuals Import tool. All you need to do is select the file you wish to import and tell the MRM which time period it’s for and which payment processor it’s from. The system will then parse the data from the report and make it available in the same flexible, convenient reporting tools as the rest of your reporting.
Once you make the switch, you’ll never have to worry about manually reviewing your old residuals reports ever again. Just import them into the system and let the MRM do the rest.
Mobile Access to Key Residuals Data
Mobile Access to Key Residuals Data
Access Your Residuals KPIs From Your Smartphone Whenever You Need Them.
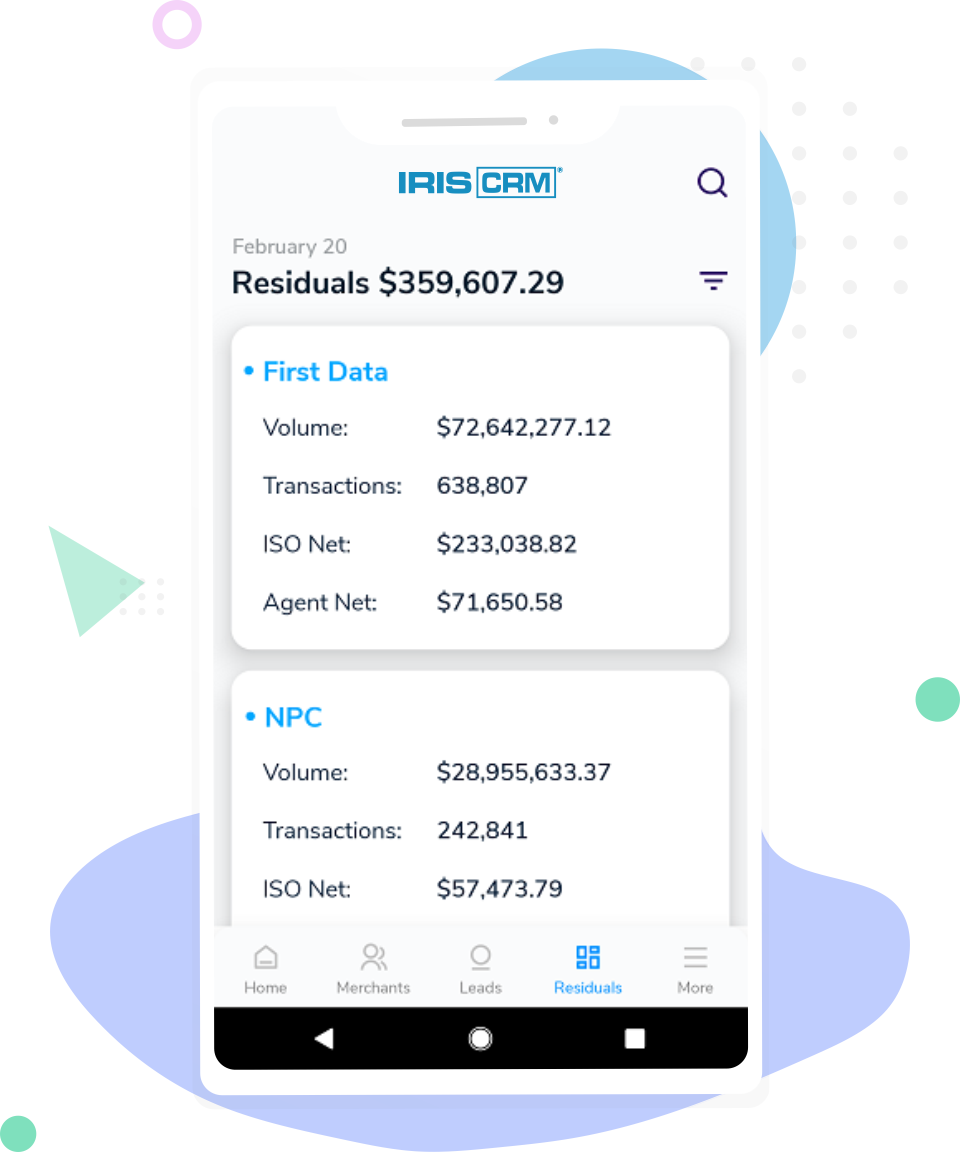
The new MRM mobile app provides your team convenient access to essential residuals data anywhere, anytime.
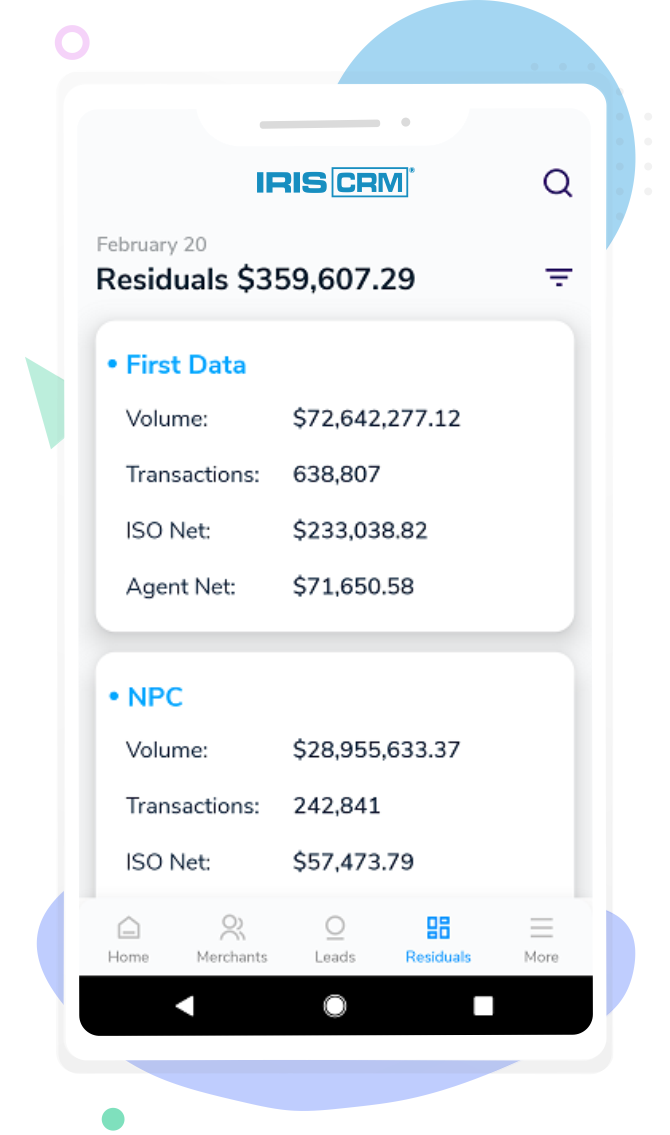
Opening the app’s residuals tab provides an overview of the month’s residuals broken down by each payment processor. The information includes gross sales volume, transaction volume, your ISO’s net residuals and your agents’ total net residuals. Tapping on any payment processor brings up a complete list of all the merchants you have onboarded to them, with the same data categories available at the processor level (with the addition of the agent split percentage).
In addition to providing fast, convenient access to your key residuals data, the MRM mobile app also offers merchant relationship management, a complete set of lead management tools, dialer access, helpdesk ticket management and more. The app automatically syncs with your web-based system, so your agents can access everything they need from their mobile devices.
Available now for Android and iOS in the Google Play and Apple App stores.
Talk to
Our Team
Fill out the form and a member of our team will get in touch with you to go over any questions you have.
